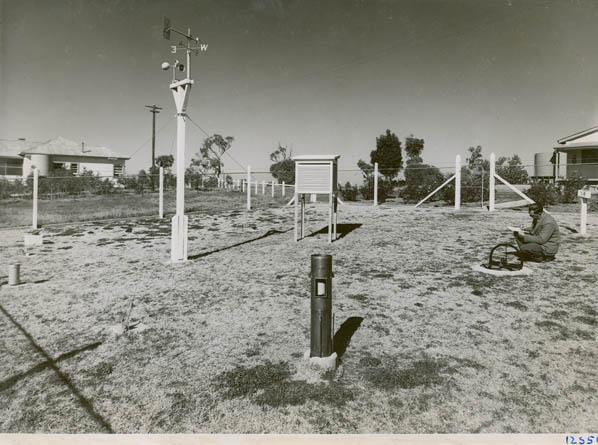
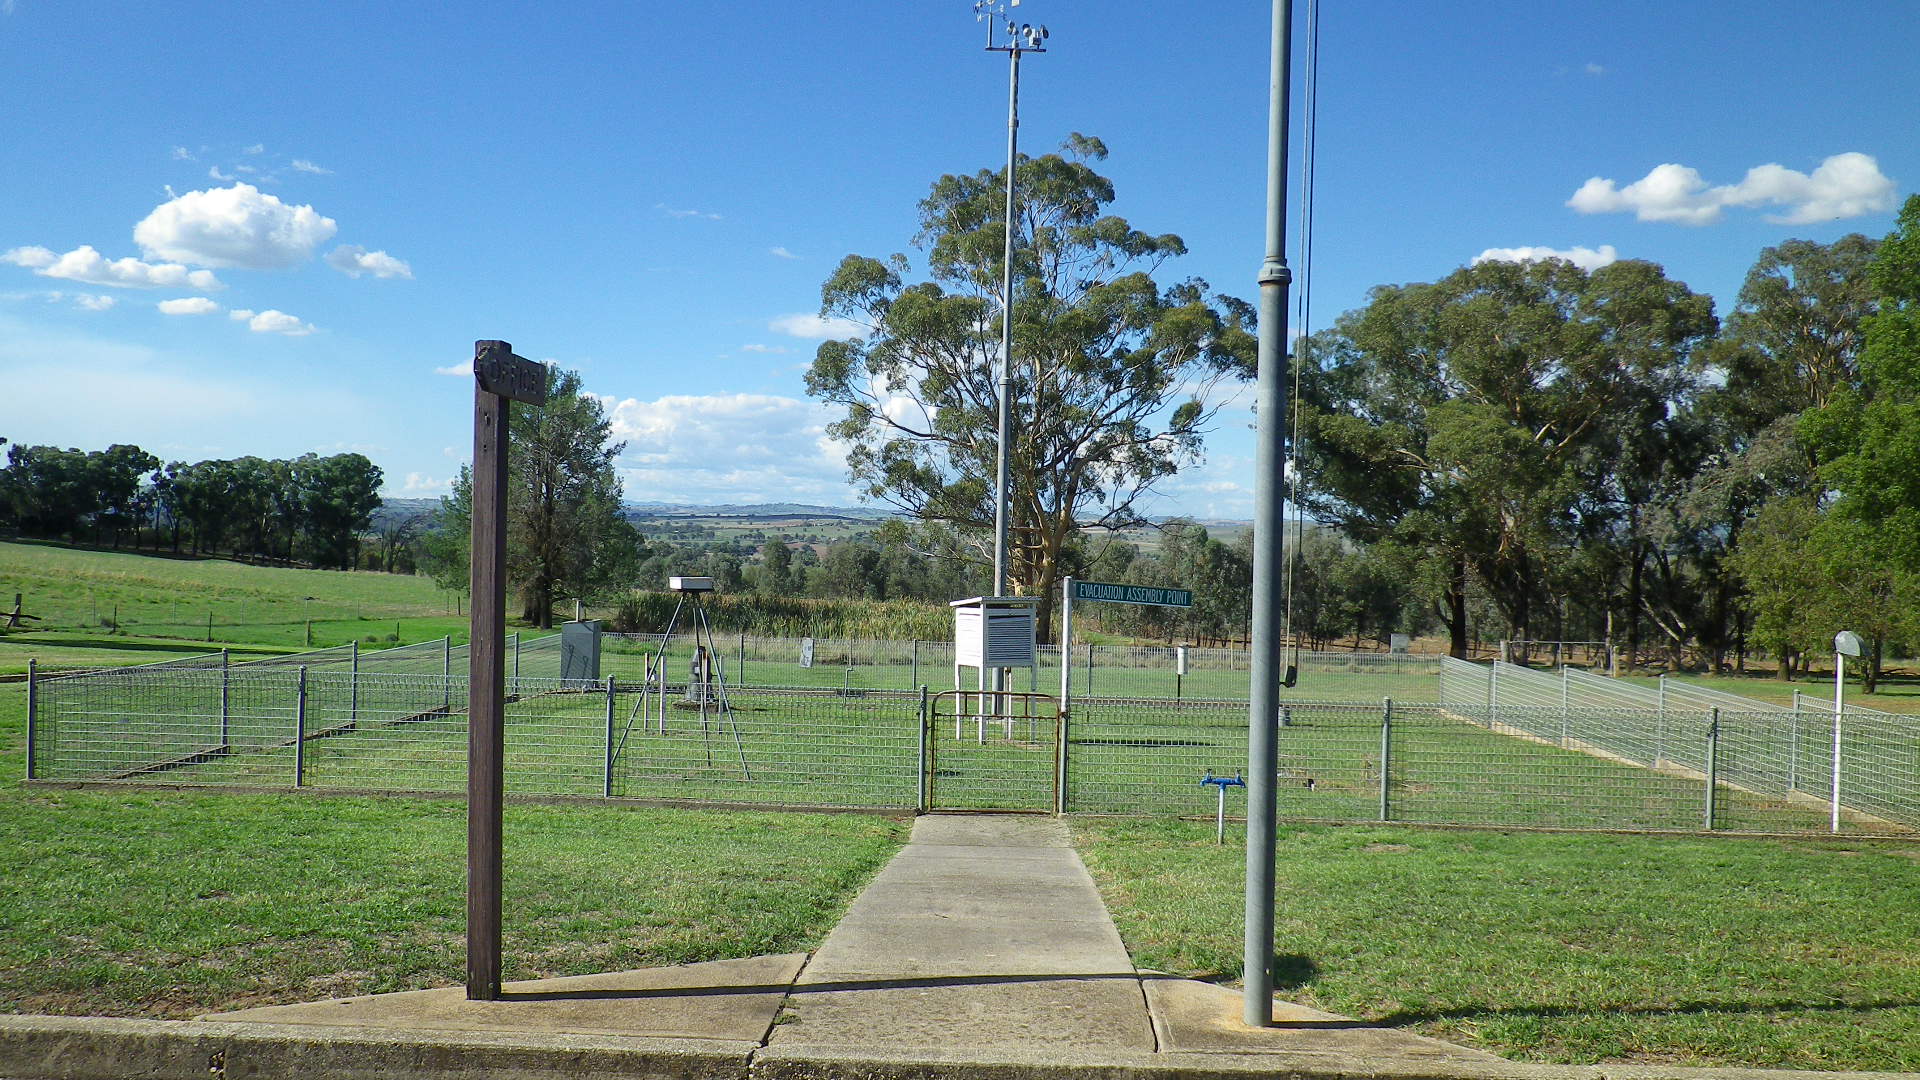
Can historical soil temperature data tell us about climate change? Of course Yes, it all began when we visited the Cowra Agricultural Research station and Brian Murphy showed us the soil temperature data from a depth of 1.8 m which was collected daily since 1942. The data show a gradual increase in soil temperature over time. So we looked further into this data and also analysed data from BOM stations in Gunnedah, Inverrel and Brigalow. They are all (ex-) agricultural research stations. Our study is published in the March 2018 issue of Geoderma.
Historically, soil temperature data have been measured and recorded mainly for agricultural applications. Lambert (1779) in Germany and Forbes (1846) at Edinburgh in Scotland published time series of measurements of soil temperature at various depths. Many research stations around the world that recorded weather data also recorded soil temperature at one or more depths. In Australia, it is commonly measured daily at 09.00.
Soil temperature data at Cowra in New South Wales, Australia was recorded daily at 09.00 at a depth of 1.8 m from 1942 to 2010, together with rainfall and maximum and minimum air temperature data. From 1972 temperatures at some shallower depths were also recorded. We found significant average annual temperature rises in soil and air temperature data, with greater rises in the soil temperatures over this period.We also analysed soil and air temperature data recorded from 1970 at Gunnedah, Inverell, and Brigalow in eastern Australia.
To standardise for soil temperature measurements taken at various depths, we proposed a model that estimated the rise of the ground surface temperature accounting for the attenuation and delay of the surface temperature signal with depth.
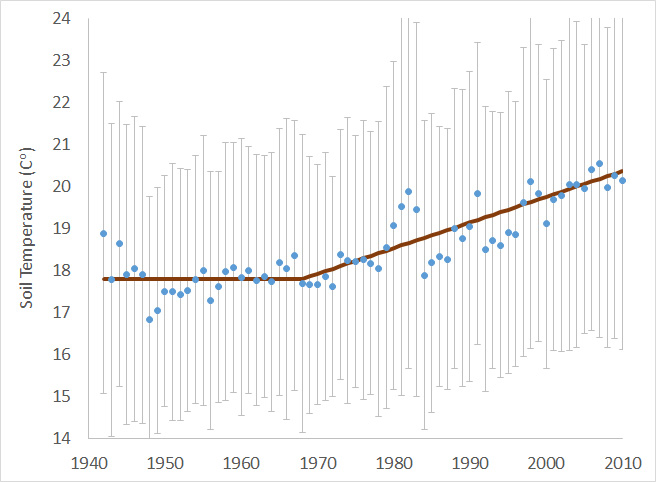
Soil temperature at Cowra shows a steady increase since 1968. The bars show the standard deviation of the annual mean.
We estimated the rise of the soil surface temperature Cowra from about 1970 as 0.06 K year− 1. We found the rate of rise of the average of the daily maximum and minimum air temperatures to be 0.022 K year− 1. For Gunnedah, Inverell, and Brigalow, from 1970 the rates of rise of soil temperatures at 1 m and air temperatures were at around 0.02 K year− 1. These soil temperature data show a clear warming trend overall since about 1970. These kind of data provided real information of soil temperature increase which will be useful to study its impact on microbes and plants. Sadly the Cowra Meteorology station was stopped in 2010, and the Brigalow research station in Qld was sold in 2013.
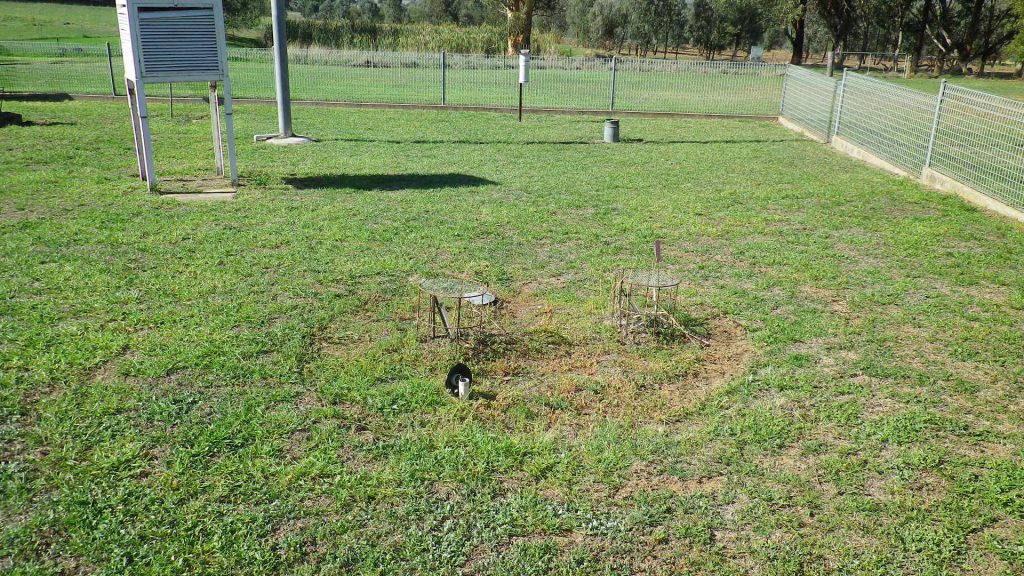
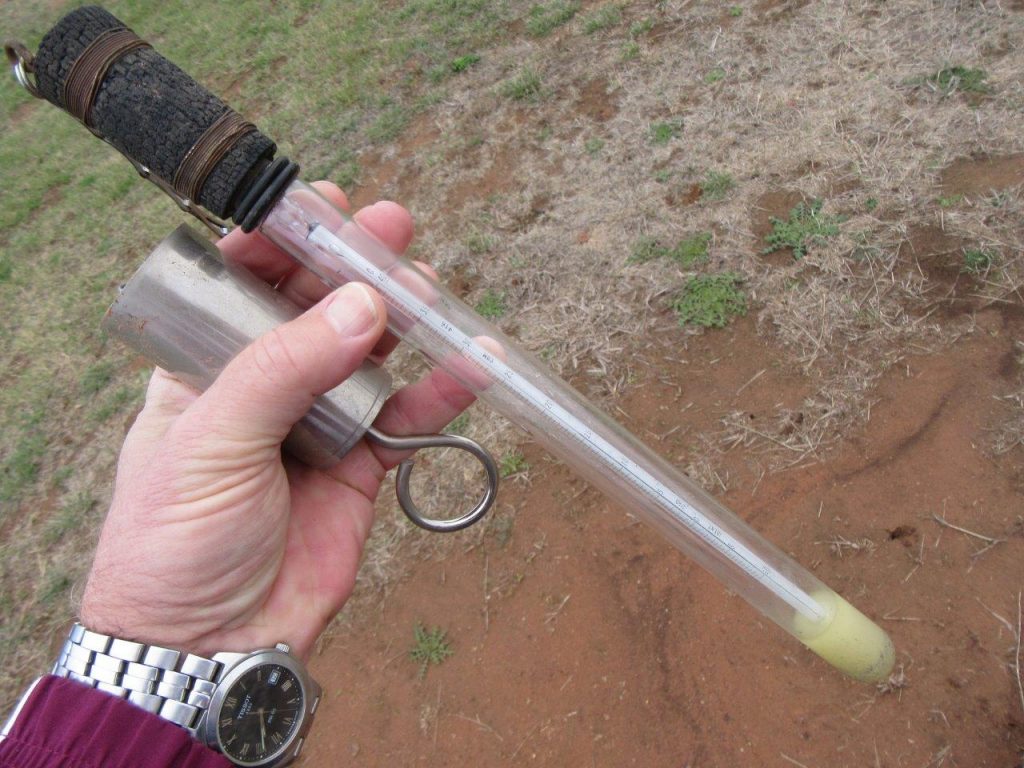
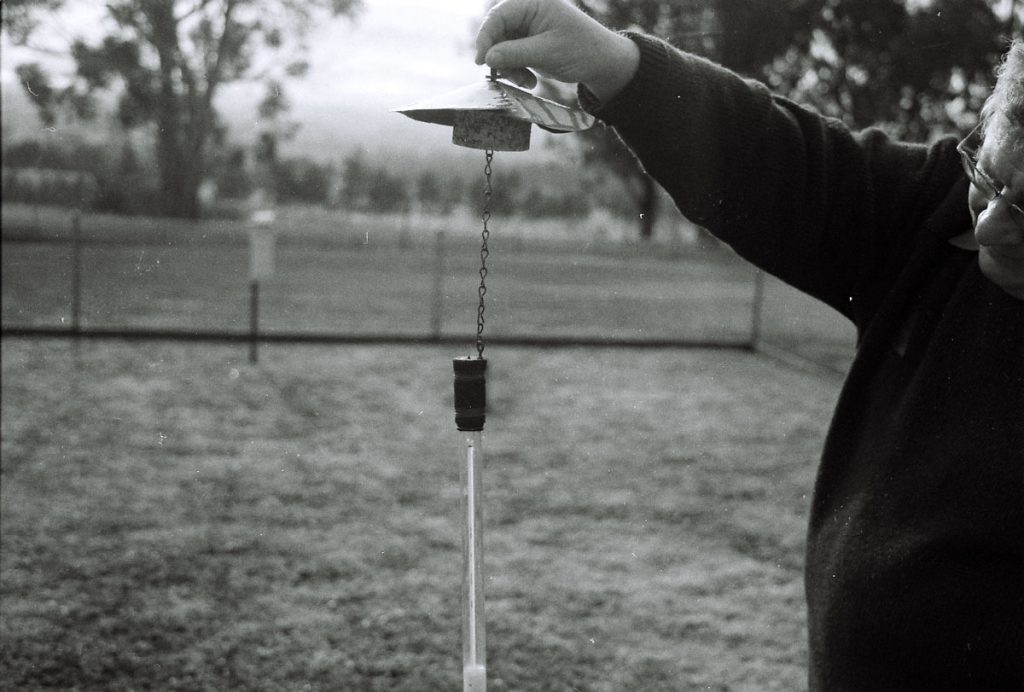
Soil temperature probe used in the Cowra research station. Photos by Brian Murphy.
So what are implications of this study?
First, soil temperature has been increasing for the past 50 years, and the increase is gradual rather than sudden. Thus many of the heating soil experiments will create unnatural change and response in microbial and plant activities.
Second, over 40 years, there is an extra annual heat storage in soil of 12.8 ± 1.3 × 10⁸ J m− 2 at Cowra and 4.3 ± 0.4 × 10⁷ J m− 2 at Gunnedah, Inverell, and Brigalow. Or 1.075 MJ m− 2 yr− 1 at Gunnedah, Inverell, and Brigalow and 3.25 MJ m− 2 yr− 1 at Cowra.
Third, over 40 years the soil temperature rises of 2.44 K at Cowra and 0.8 K at Gunnedah, Inverell, and Brigalow will cause increases in the reaction rates for the greenhouse gases carbon dioxide and nitrous oxide of 18% and 5.7%, respectively.
Leave a Reply