
Cartography is a blend of art and science. But can art be used as covariates in making digital maps? According to a new research yes, and the results are comparable with using real covariates.
Ecology mappers face the same problem as DSMers, which covariates should be used for digital mapping? Machine-learning algorithms supposedly can handle a large number of predictors and even select and identify the relative importance of the covariates. In a Species Distribution Modelling (SDM) study, the researchers tried to see what happened if classic paintings were used as covariates.
The authors from Sweden and France predicted the distribution of 509 European species (independently) using 2 scenarios: 20 fake predictors derived from classical paintings, and 20 climatic and topographic variables. The predictors were transformed using PCA and the first 12 PCs were used to derive a model using MaxEnt (Maximum Entropy model commonly used in SDM).
The data was split into calibration and validation, and the performance of the model was evaluated using AUC and TSS.
AUC is area under the receiver operating characteristic curves. It ranges from 0 when there is a total mismatch between model predictions of presence and the actual data and 1 for models with perfect discrimination abilities. A value of 0.5 indicates that the model does not perform better than any model with a set of random predictors.
TSS (True Skill Statistic) was calculated as sensitivity + specificity − 1. Sensitivity is the probability that the model will correctly classify a presence. Specificity is the probability that the model will correctly classify an absence. +1 indicates perfect agreement and values of zero or less indicate a performance no better than random.
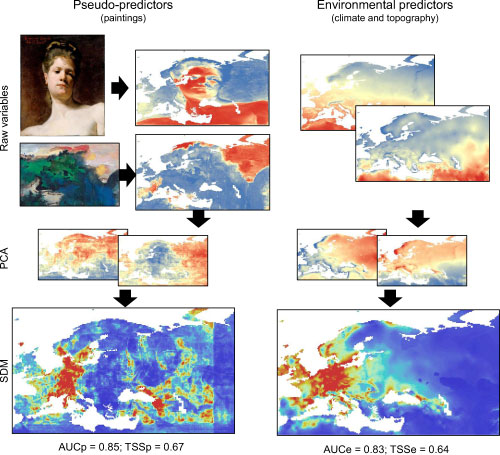
A workflow of the study, quite creative in creating fake predictors, and results show that it sometimes predict better than using real predictors. From Fourcade et al. 2017.
Their results showed that models that used paintings as predictors are often classified as good or even excellent according to the widely used evaluation measures. (Like DSM, some like to use some made-up classification of RPD to justify prediction to be excellent, good, afir .. etc.. AUC values are also being classified as excellent, good, fair, ..).
The authors conclude that the species modelling using unrelated predictors can achieve good results, and thus they question the current practices in terms of model evaluation and variable selection.
Someone could replicate this in DSM studies, but the main message is that I got out of it
- the model (MaxEnt) cannot select useful predictors, mostly it overfits the data
- the goodness of fit metric they used is insensitive. As I repeatedly warned, it is bad to classify goodness of fit into classes of excellent, good, fair etc.
- In the supplementary material (Figure below), the result shows that fake predictors usually perform less than real predictors. However, the difference becomes small with increasing number of predictors, again showing overfitting of the model.
- The SDM only evaluates the presence or absence for a species at a time. Thus there is always a random chance that a random model can predict better.
- A proper validation and selection of covariates is important. Don’t just trust “variable selection” algorithm.
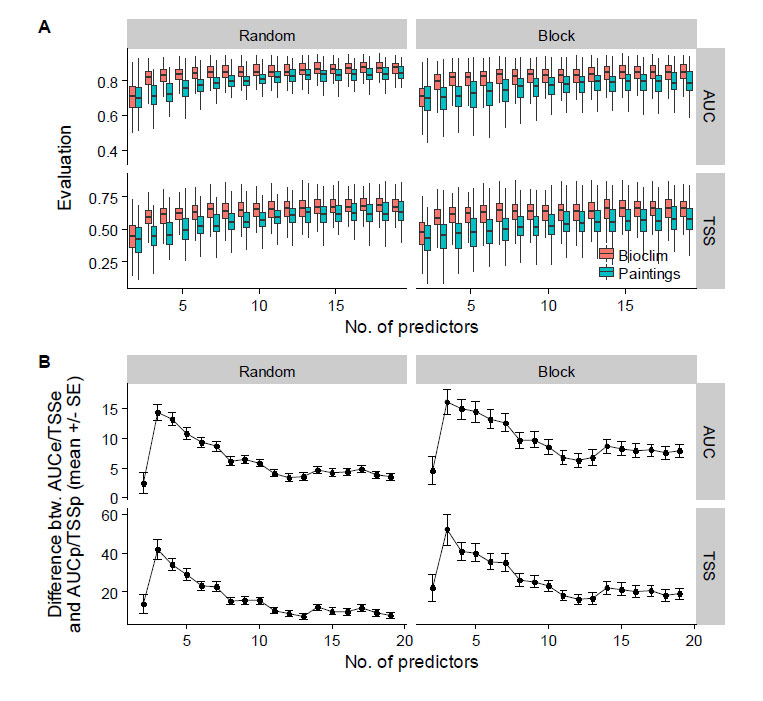
Relationship between the number of variables used as predictors in SDMs and (A) the models evaluation metrics (real predictors in red, fake predictors in blue); (B) the mean difference (% ± standard-error) in evaluation metrics between models built from real and fake predictors. Results are shown for 100 randomly chosen species, and evaluations were carried out by splitting occurrences into training and testing points by geographic blocks (left column) or randomly (right column). From Fourcarde et al. (2017).
Given that SDM usually only evaluates the presence/absence for a particular species, I think they are more prone to getting random chance of fake prediction.
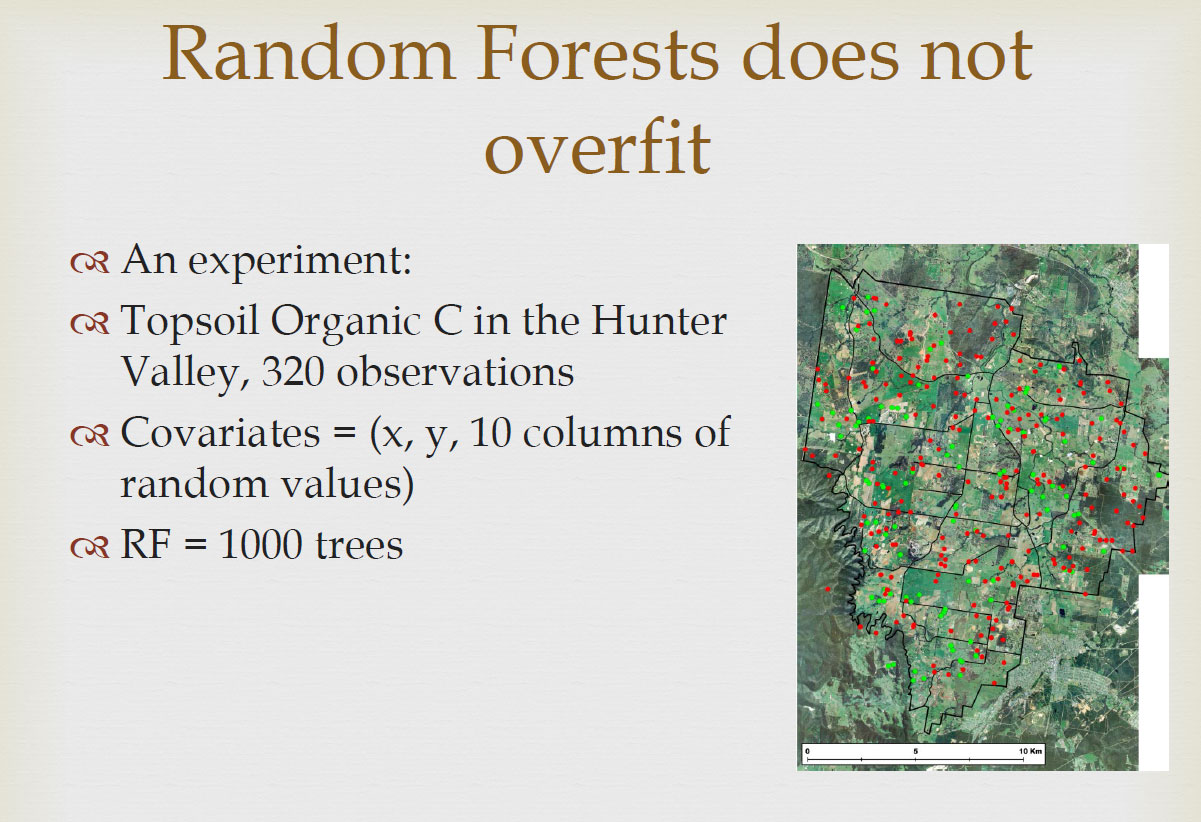
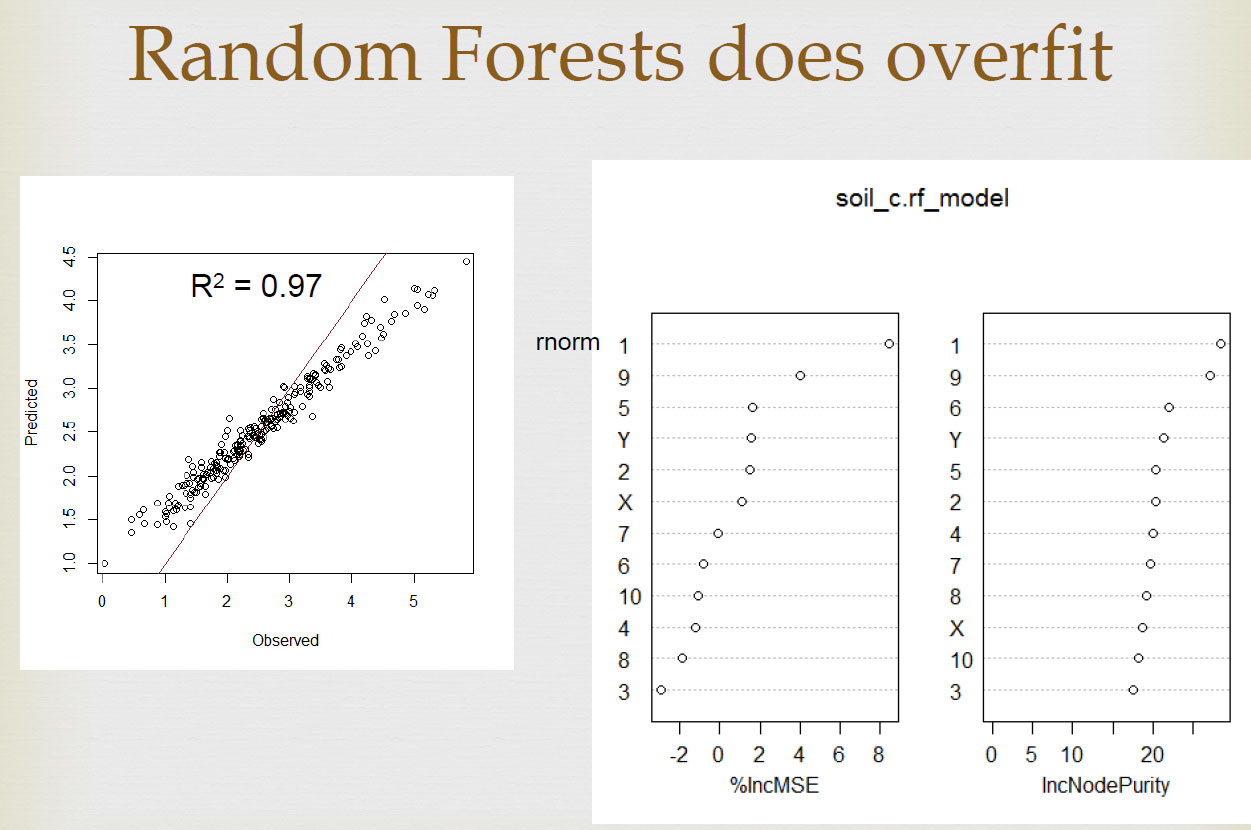
We did a similar experiment with Random Forests sometime ago, we created fake predictors using random values and predicted a continuous variable (C content). The results show that RF give excellent results on the calibration data, but not on validation data. We also talked about it in this article.
Reference:
Fourcade, Y., Besnard, A.G. and Secondi, J., Paintings predict the distribution of species, or the challenge of selecting environmental predictors and evaluation statistics. Global Ecology and Biogeography.
Leave a Reply