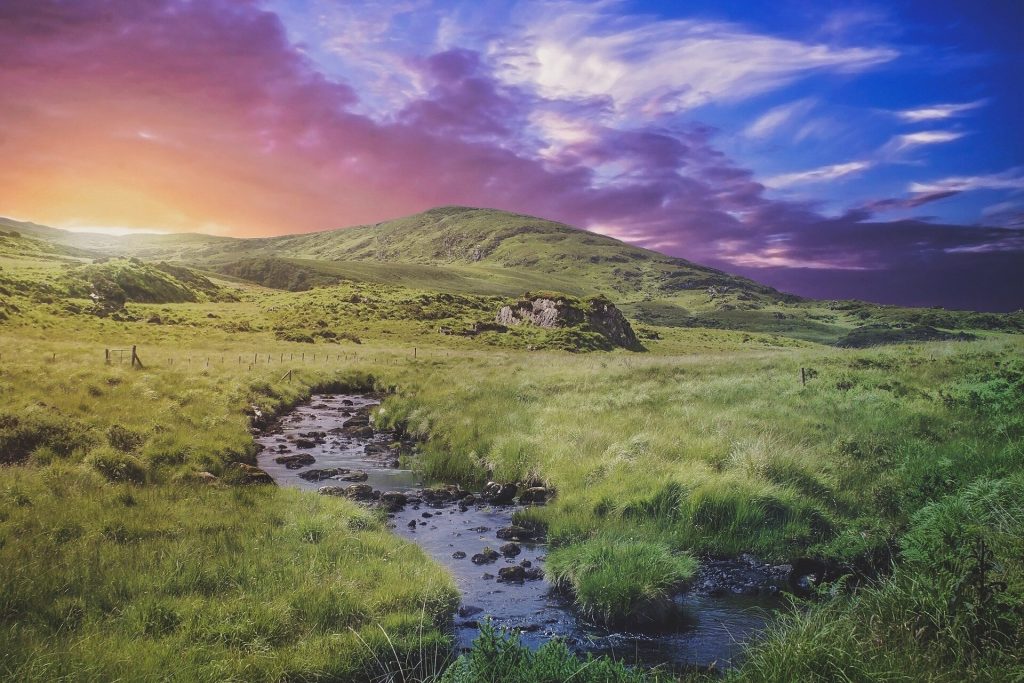
We wanted to know how much peatland there is in the world.
Why? Because peatlands can store carbon (C) and help regulate the climate. But, peatland degradation is releasing C into the atmosphere. To conserve peatlands and halt their contribution to atmospheric carbon, we need to understand their extent, status, and C stocks.
What we did was reviewed 90 recent peatland mapping studies.
We found that global peatland estimates are vague, ranging from 1 to 4.6 million km2, and C stock estimates vary between 113 and 612 Pg (or billion tonne C). This uncertainty mostly stems from coarse-scale global soil maps. To get more accurate peatlands maps, combine
digital soil mapping (from field observations) with remotely-sensed images such as satellite data. It is important to use more than one covariate, and to validate mapping results.
We also looked at 12 national case studies on peatland mapping, and reviewed the remote-sensing technology that can be used to map peatlands.
Peats formed as an accumulation of decomposed organic materials. It is the largest store of carbon on land (in terms of the amount of carbon over an area). Peatlands cover about 3% of the earth’s land surface but can hold as much as half of the CO2 that is in the atmosphere.
For over 1000 years, peatlands have been mined for fuel and fertilizer and used for grazing and agriculture. Climate change and rapid land use change have made peatlands released their stored carbon, and adding to atmospheric carbon dioxide. Global peatlands are degrading, and immediate action is necessary to prevent further decline. To conserve peatlands and help in realising the Paris Agreement, we need to understand their distribution and conditions.
A group of 20 researchers from different papers of the world recently conducted a critical review of how peatland mapping could be improved to provide better maps to support action and multi-stakeholder engagement. The paper published in the September 2019 Earth Science Reviews found that current global peatland knowledge is vague—estimates of global peatland extent range from 1 to 4.6 million km2 and C stock estimates vary between 113 and 612 billion tonne C. This uncertainty mostly stems from the coarse spatial scale of global soil maps. Most global peatland estimates are based on rough country inventories and reports that use outdated data.
The researchers describe peat mapping experiences from 12 countries or regions (Brazil, Chile, Indonesia, Australia, New Zealand, Ireland, USA, Scotland, The Netherlands, Finland, Sweden, and Canada) and review 90 recent studies on peatland mapping. They found that interest in mapping peat information derived from satellite imageries and other digital mapping technologies is growing.
The review highlights proximal and remote sensing techniques that can be used to map peatlands. These include geophysical measurements (electromagnetic induction, resistivity measurement, and gamma radiometric), radar sensing (SRTM, SAR), and optical images (Visible and Infrared). They found that peatland is better mapped using field observations combined with more than one source of remotely-sensed data, such as optical and radar products.
The proliferation of satellite data available in an open-access format, availability of machine learning algorithms in an open-source computing environment, and high-performance computing facilities could enhance the way peatlands are mapped.
Finally, the researchers recommended that digital soil mapping allows us to map peat in a cost-effective, objective, and accurate manner. Securing peatlands for the future, and abating their contribution to atmospheric C levels, means digitally mapping them now.

Leave a Reply